

Streamlining Goal Setting and Tracking with OKR Dashboard
Application

Created an intuitive OKR website and dashboard to simplify goal setting and enhance collaboration.
Created an intuitive OKR website and dashboard to simplify goal setting and enhance collaboration.
Role:
Application Design, UI/UX Design
Duration:
3 months
Tools:
Figma, FigJam, Photoshop, Notion, Miro
Project type:
End-to-end product design project for Turnkey Goal System (TGS) & Organizational Performance System (OPS)
Target users:
Business leaders, HR professionals, managers, and employees in organizations seeking goal alignment, performance tracking, and engagement solutions.
Contribution:
User research, Stakeholder interviews, User journey mapping, Competitive analysis, Jobs-to-be-Done (JTBDs), Ideation, Paper prototype, High-fidelity prototype, Interaction design, Usability testing, Design system integration, Project management, AI-driven insights integration, Performance tracking optimization.
Outcome:
Successfully launched, improving goal-setting adoption and engagement.
Enhanced alignment, real-time tracking, and usability, leading to higher retention.
The Challenge
Organizations today face increasing pressure to align their teams, set clear goals, and track performance in a way that drives meaningful results. However, many struggle with fragmented goal-setting processes, lack of visibility into progress, and difficulty in maintaining engagement across teams. Without a structured system, businesses risk losing focus, misaligning priorities, and failing to execute their strategies effectively.
Turnkey aims to solve this challenge with the Turnkey Goal System (TGS) and the Organizational Performance System (OPS)—an integrated platform designed to bring clarity, accountability, and alignment to goal-setting. However, designing an effective OKR dashboard requires overcoming key obstacles: ensuring usability, increasing adoption, and providing data-driven insights that empower leaders and employees alike. The challenge lies in creating a system that is powerful yet intuitive, AI-driven yet transparent, and structured yet flexible to support different organizational needs.
The Turnkey dashboard must go beyond goal tracking to become a high-impact performance management system, driving alignment, simplifying OKR tracking, and enhancing employee engagement for organizational success.
Defining the Problem
Analyzing Turnkey’s Challenges
To build an effective OKR dashboard for Turnkey, I first analyzed common challenges organizations face when setting, tracking, and managing their goals. Through market research, industry reports, and feedback from businesses using OKR platforms, I identified key issues that need to be addressed in the design.

Findings from Market Research & Industry Insights
Identified Problems
Findings from Market Research & Industry Insights

Recruiting and Talking to Users
To ensure the Turnkey Goal System (TGS) and Organizational Performance System (OPS) effectively address real user needs, we engaged directly with organizations struggling with OKR adoption, performance tracking, and goal alignment. Our goal was to uncover pain points, validate assumptions, and identify opportunities for improvement.
We initially reached out to business leaders and managers who had previously provided feedback on performance management challenges through Turnkey’s client success team. However, response rates were low. To expand our reach, we used targeted feedback requests within the existing platform, focusing on users who had interacted with OKR tracking features. In the end, we conducted 12 in-depth interviews with HR leaders, department heads, and team managers.
Key Insights from User Interviews
I want to see clear alignment between individual, team, and company goals – Users struggled to understand how their daily tasks connected to broader business objectives.
I need a simple, intuitive way to track and update OKRs – Many found existing goal-tracking tools too complex, leading to inconsistent adoption.
I want AI-driven insights, but I also need transparency – Users were hesitant to trust AI-generated performance recommendations without clear explanations.
I need real-time feedback and collaboration tools – Managers and employees wanted a system that allowed quick check-ins, status updates, and recognition of achievements.
I don’t want to manage multiple tools for goal setting and performance tracking – Users preferred an all-in-one solution that integrates OKRs, performance reviews, and engagement metrics.
Workshop #1 - User Journey Mapping
The second workshop I facilitated was a User Journey Mapping session to visualize the end-to-end experience of users interacting with the Turnkey Goal System (TGS) and Organizational Performance System (OPS). This workshop helped us refine a broad challenge into a more specific, actionable scope for our first design iteration.

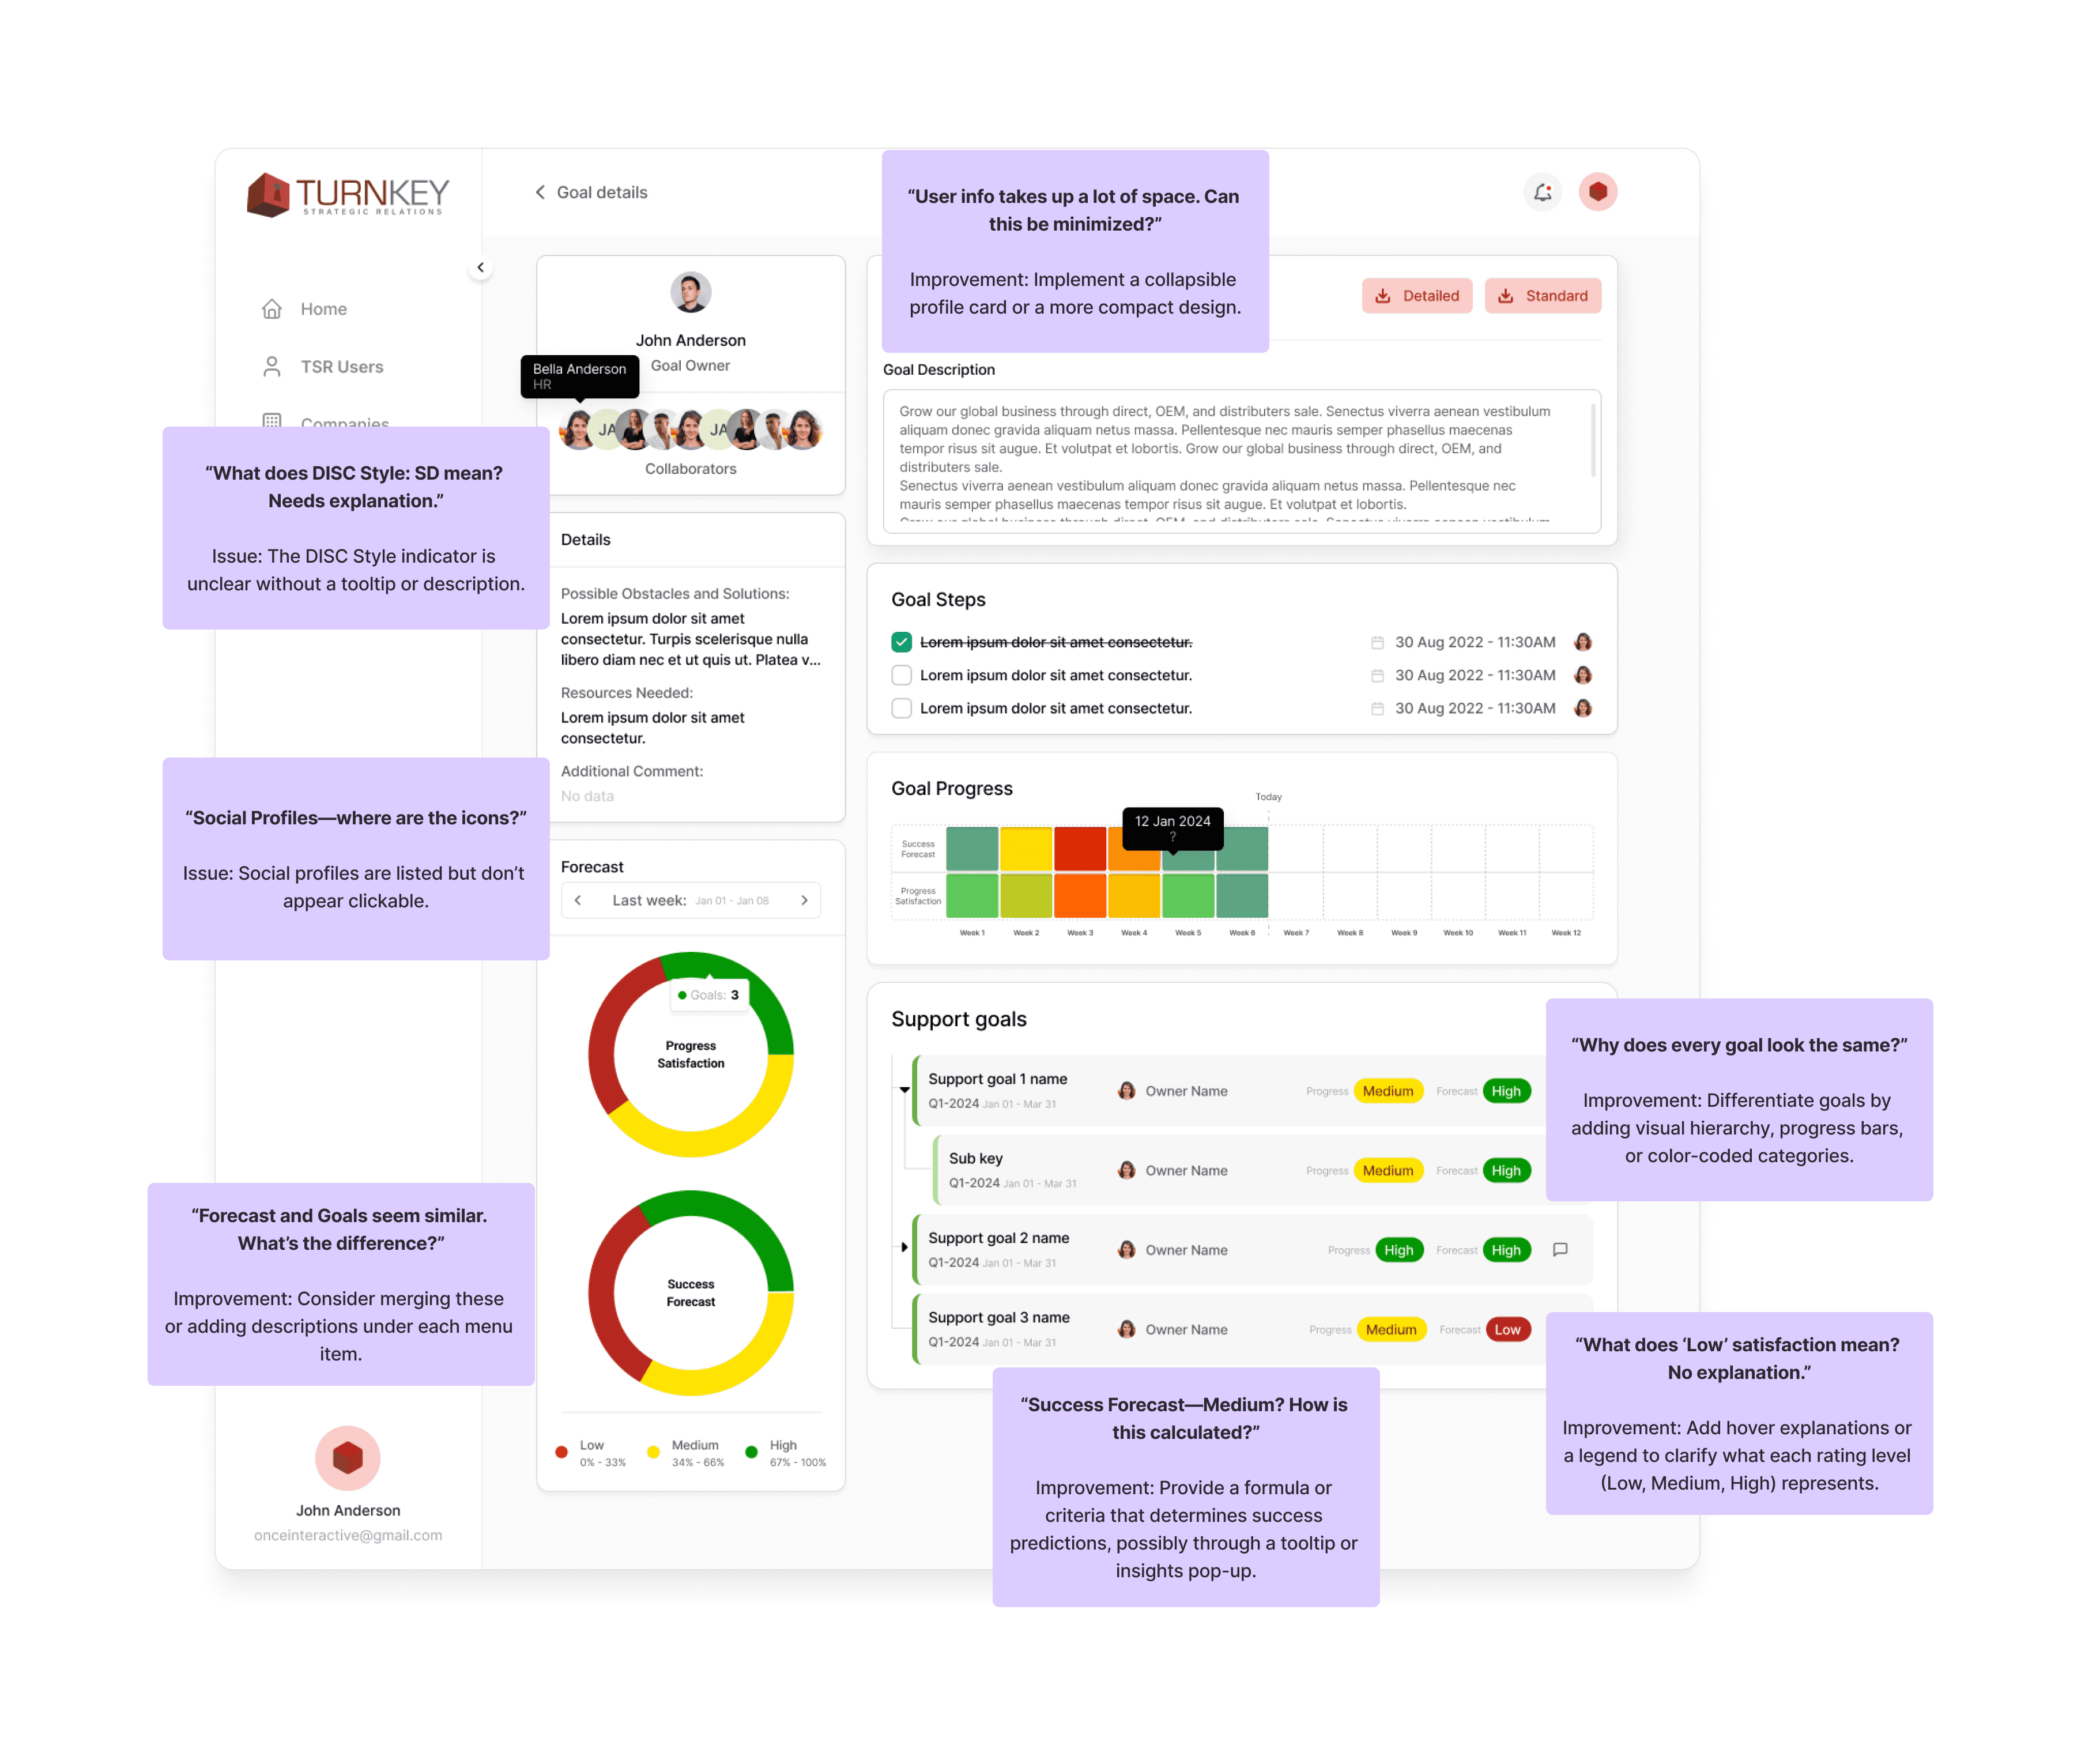
User Feedback and Areas for Improvement in the Turnkey OKR Dashboard
Through user testing and feedback analysis, several areas of improvement were identified in the Turnkey OKR dashboard. Navigation clarity is a key concern, as users struggle to distinguish between similar sections like “Goals” and “Forecast,” and the absence of a highlighted active menu item makes orientation difficult. Additionally, the goal forecasting section lacks transparency, with users questioning the meaning of progress satisfaction ratings, success forecasts, and the purpose of the “Analysis” button. The user profile and organizational chart section also presents issues, including redundant employee listings and unclear DISC style labels. Users expressed the need for better visual hierarchy, particularly within goal lists, where similar objectives appear repetitive and difficult to scan. Lastly, pagination creates friction in browsing goals, prompting requests for infinite scrolling or an expanded view option. Addressing these usability concerns will enhance engagement, simplify navigation, and improve overall user experience in Turnkey’s performance management system.
Competitor Analysis
The Objectives and Key Results (OKR) software market is experiencing significant growth, with projections indicating a rise from $1.15 billion in 2023 to $2.98 billion by 2030, reflecting a Compound Annual Growth Rate (CAGR) of 14.6% during this period.
Below is a detailed competitive analysis of leading OKR software platforms, focusing on key features, pricing, and unique value propositions:

This analysis provides a comprehensive overview of the leading OKR software platforms, highlighting their key features, integration capabilities, user experience, pricing structures, and unique value propositions. Organizations can utilize this information to select the platform that best aligns with their strategic objectives and operational requirements.
Early Ideation
With a solid foundation in place, I began designing the Turnkey OKR dashboard, focusing on usability, clarity, and engagement. The goal was to create a seamless experience for setting, tracking, and aligning OKRs.
I explored different layouts, prioritizing intuitive navigation, clear goal visualization, and AI-driven insights. Through wireframes and prototypes, I refined the workflow to ensure simple goal-setting, real-time tracking, and meaningful analytics, laying the groundwork for an efficient and user-friendly OKR platform.
UX Improvements - Single Flow
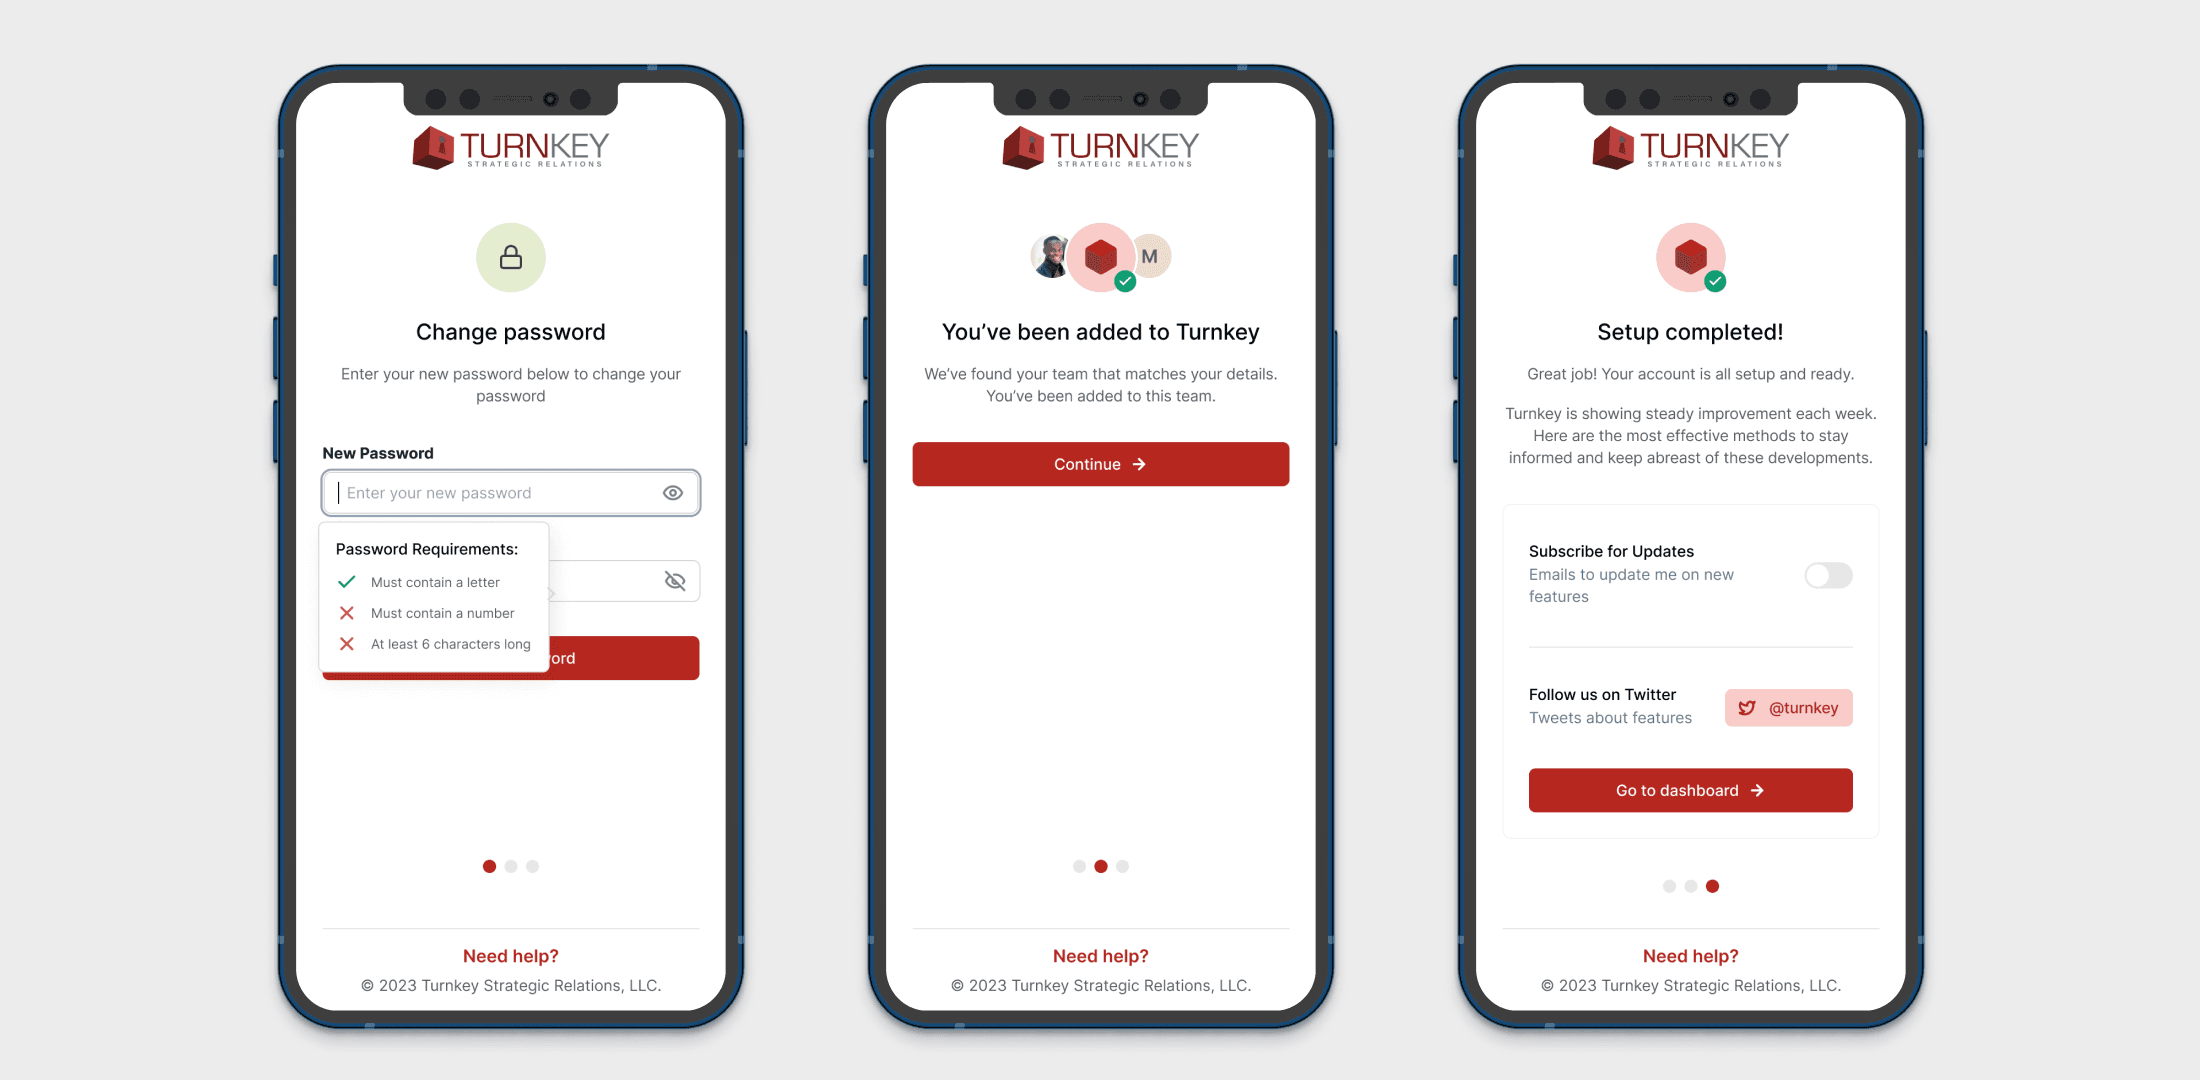
Turnkey Onboarding and Authentication Flow
This mobile-friendly onboarding and authentication flow was designed to provide a secure and seamless login experience. The process includes email and password authentication, two-factor verification (OTP), password reset, and account setup, ensuring security while maintaining ease of use. The error handling in OTP entry improves user clarity by guiding them through corrections. The final onboarding screens ensure a smooth transition into the platform, confirming team assignment and encouraging engagement with updates and social connections. This structured approach enhances security, usability, and user confidence in accessing the Turnkey platform.

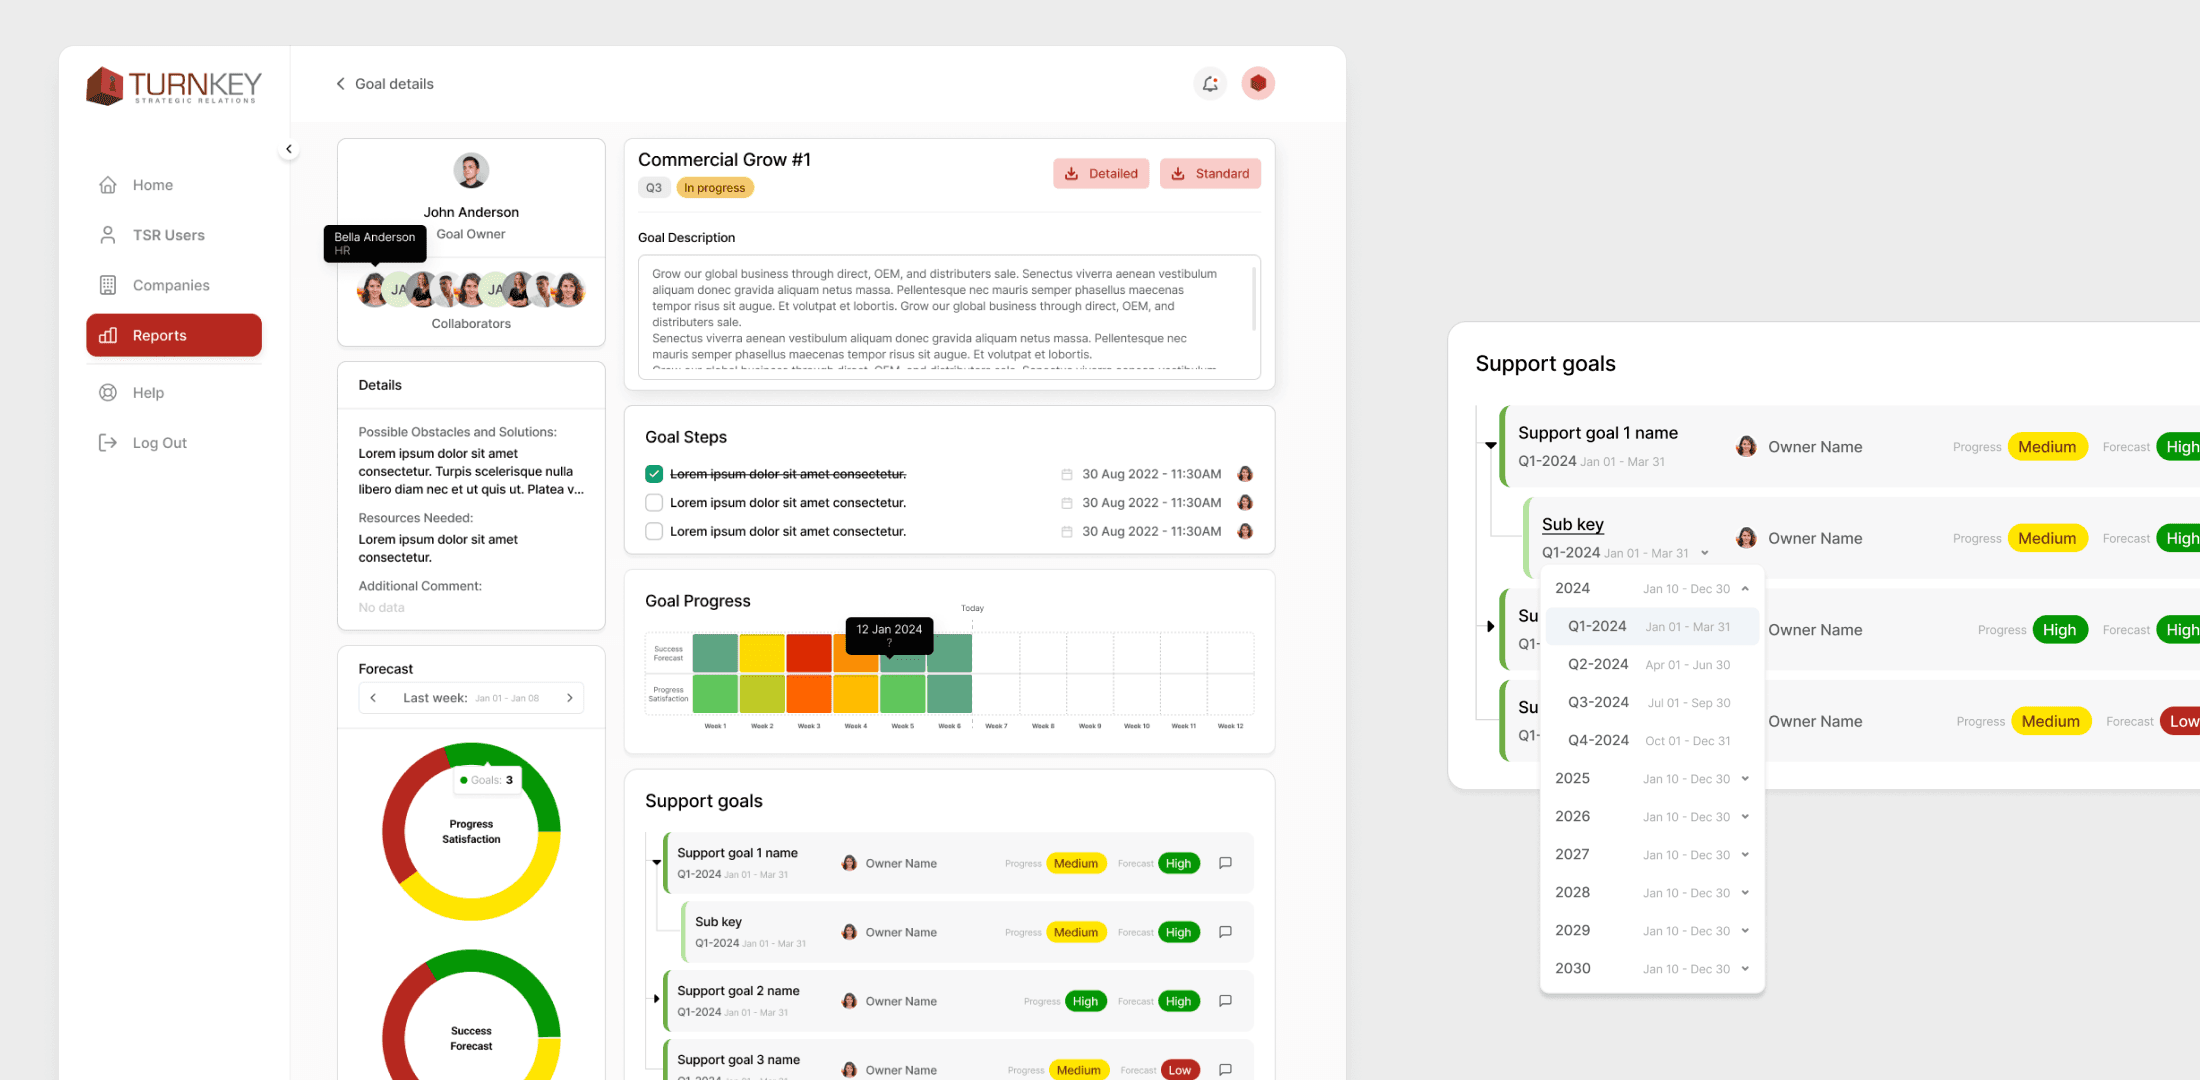
Designing the Goal Details
I designed the Goal Details page to provide a structured and visually engaging overview of goal progress, ownership, and supporting objectives. The top section highlights the goal owner and collaborators, reinforcing accountability. Below, the goal description and key action items ensure that users immediately understand the objective and its progress.
While it may seem like the goal progress heatmap and success forecast charts could be merged into a single visualization, they serve different functions. The heatmap provides a timeline of performance trends, while the success forecast focuses on future expectations. Keeping them separate allows managers to analyze both historical performance and predictive insights effectively. Additionally, the support goals section was included to show dependencies, helping teams understand how individual efforts contribute to larger objectives.
Improvements Identified
Users were unclear on the meaning of progress indicators (Low, Medium, High): I added tooltips explaining how progress satisfaction and success forecast values are calculated.
The goal description text box appeared too small, making it difficult to read longer descriptions: Increased the expandable text area for better readability.
Users wanted a clearer way to differentiate completed goal steps from pending ones: Introduced checkboxes and timestamp labels to improve visual clarity.
Some users didn’t immediately understand how support goals relate to the main goal: Added a subtle linking mechanism to show the relationship between parent and support goals.

While I plan to improve goal hierarchy visualization in future iterations, the current design balances clarity, functionality, and engagement, ensuring teams can easily track progress, identify blockers, and align on objectives.
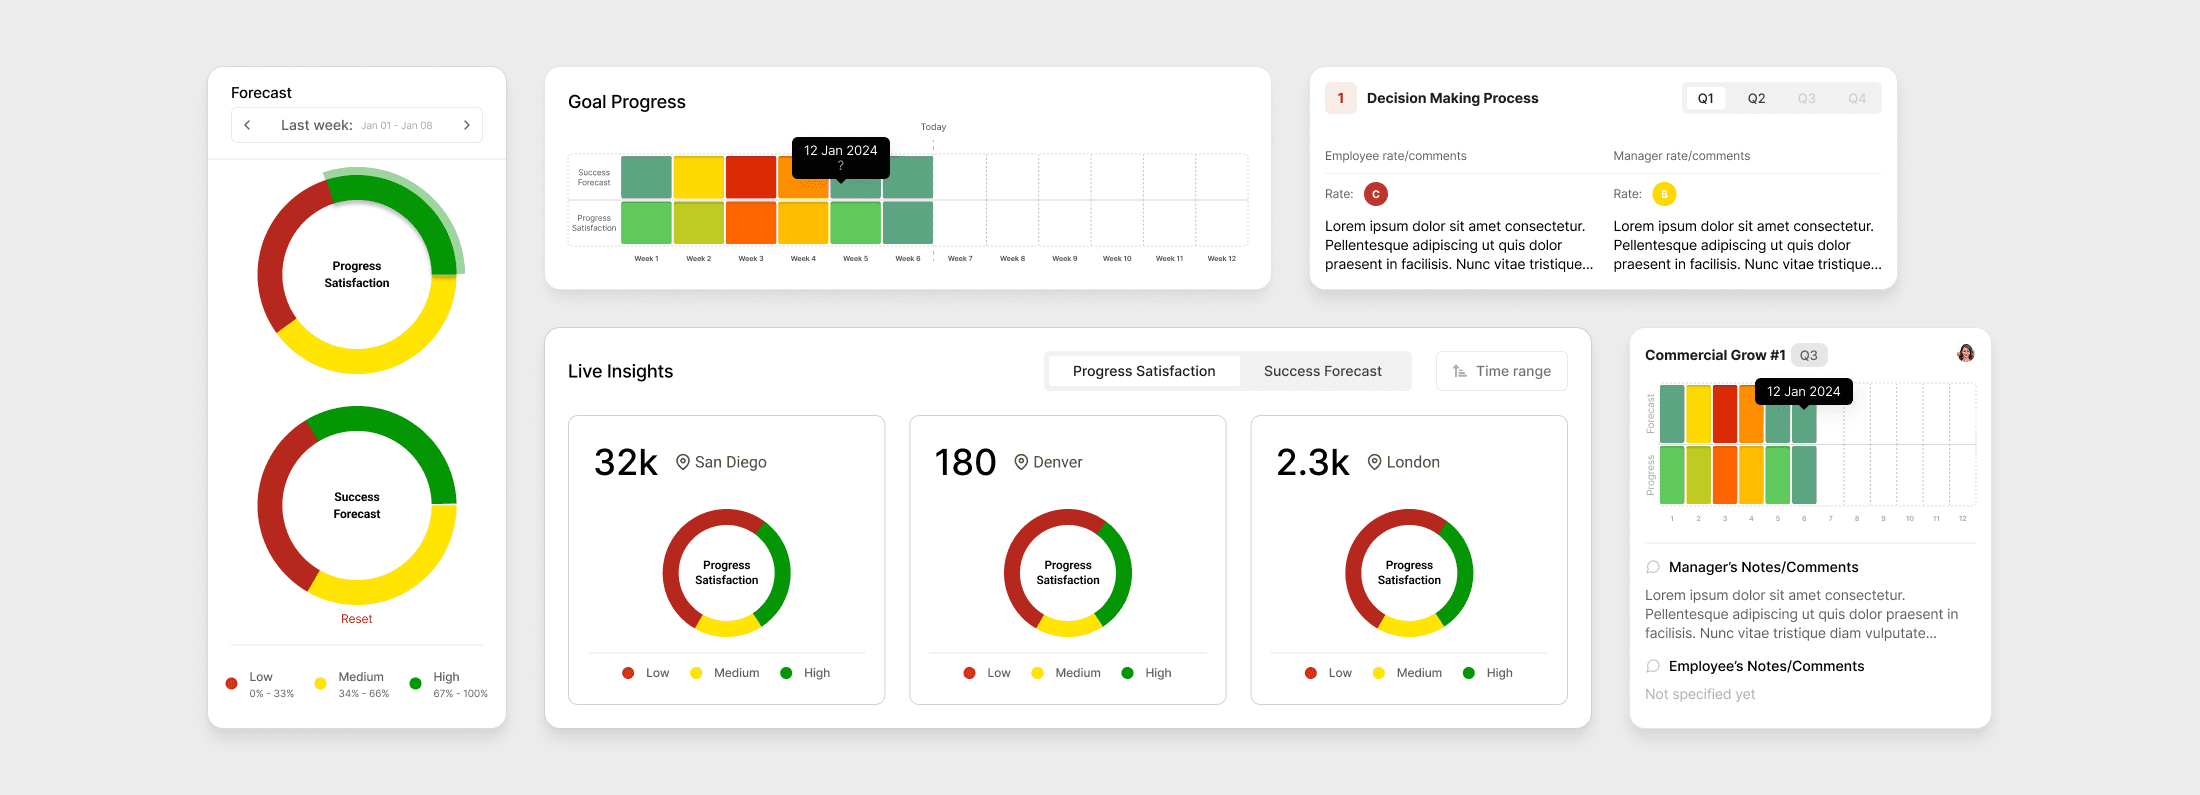
Performance Review Overview
This page provides a structured performance review layout where employees and managers can assess progress, strengths, and areas for improvement. The design prioritizes readability and clear categorization, breaking down values, competencies, and essential functions into sections. The goal compliance charts use color-coded progress indicators to make performance trends easy to understand at a glance. The right panel helps managers compare individual progress across multiple goal cycles, ensuring a data-driven, structured approach to employee evaluations.
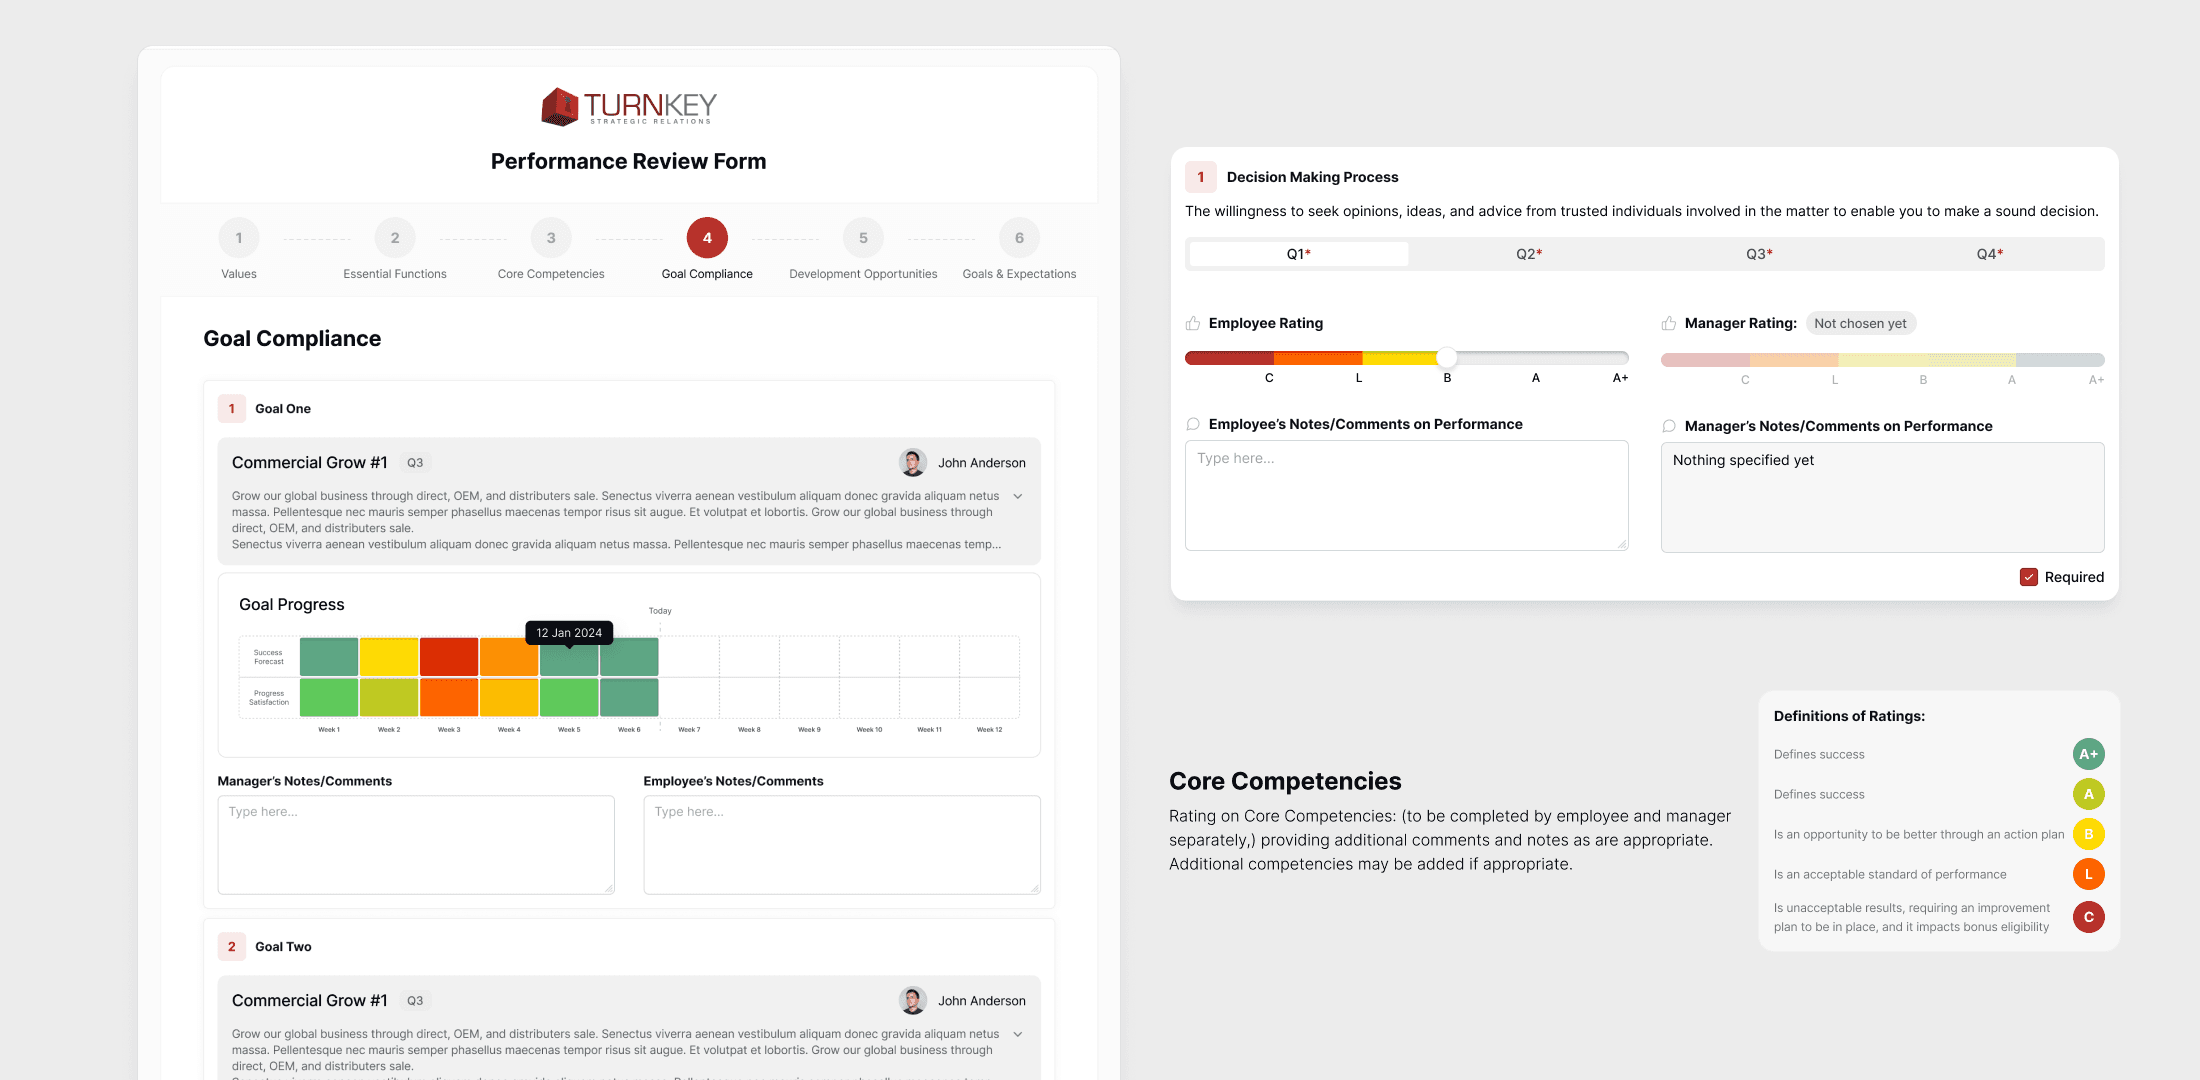
Goal Compliance Review
This page allows managers and employees to assess goal progress visually and provide feedback in real-time. The progress heatmap makes it easy to track performance trends over weeks, helping users quickly identify areas that need attention. Separating manager and employee comments ensures clear accountability, fostering meaningful discussions around performance. This structured review process encourages alignment and data-backed decision-making for performance improvement.
Performance Review Form
The Performance Review Form was designed for efficiency and ease of use, guiding users through a step-by-step process. Key details such as employee and manager names, review period, and job title are prominently placed to avoid confusion. The digital signature feature ensures authenticity while streamlining approvals. By making all necessary fields clearly visible and interactive, the form reduces friction and enhances completion rates, ensuring a smooth review process.

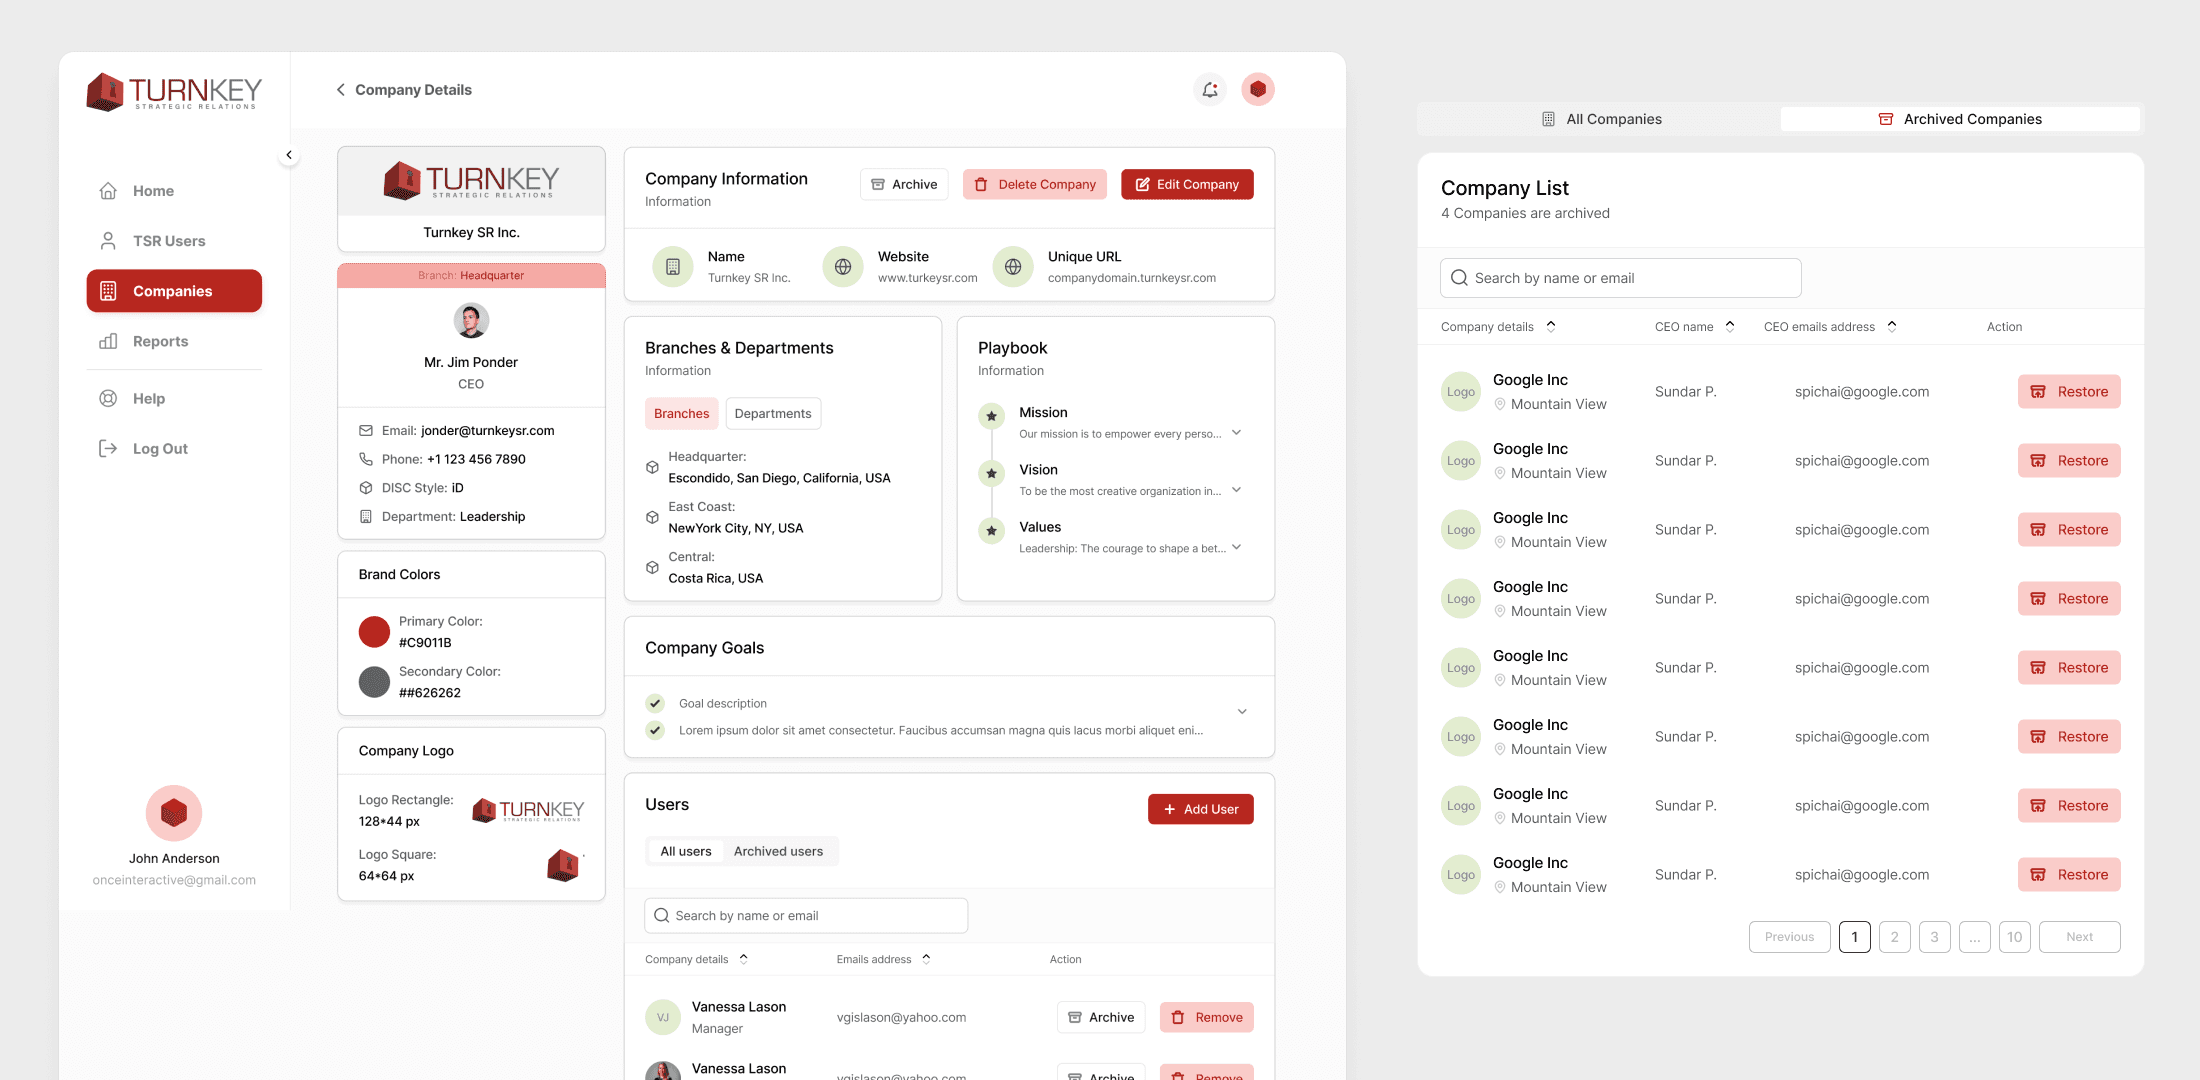
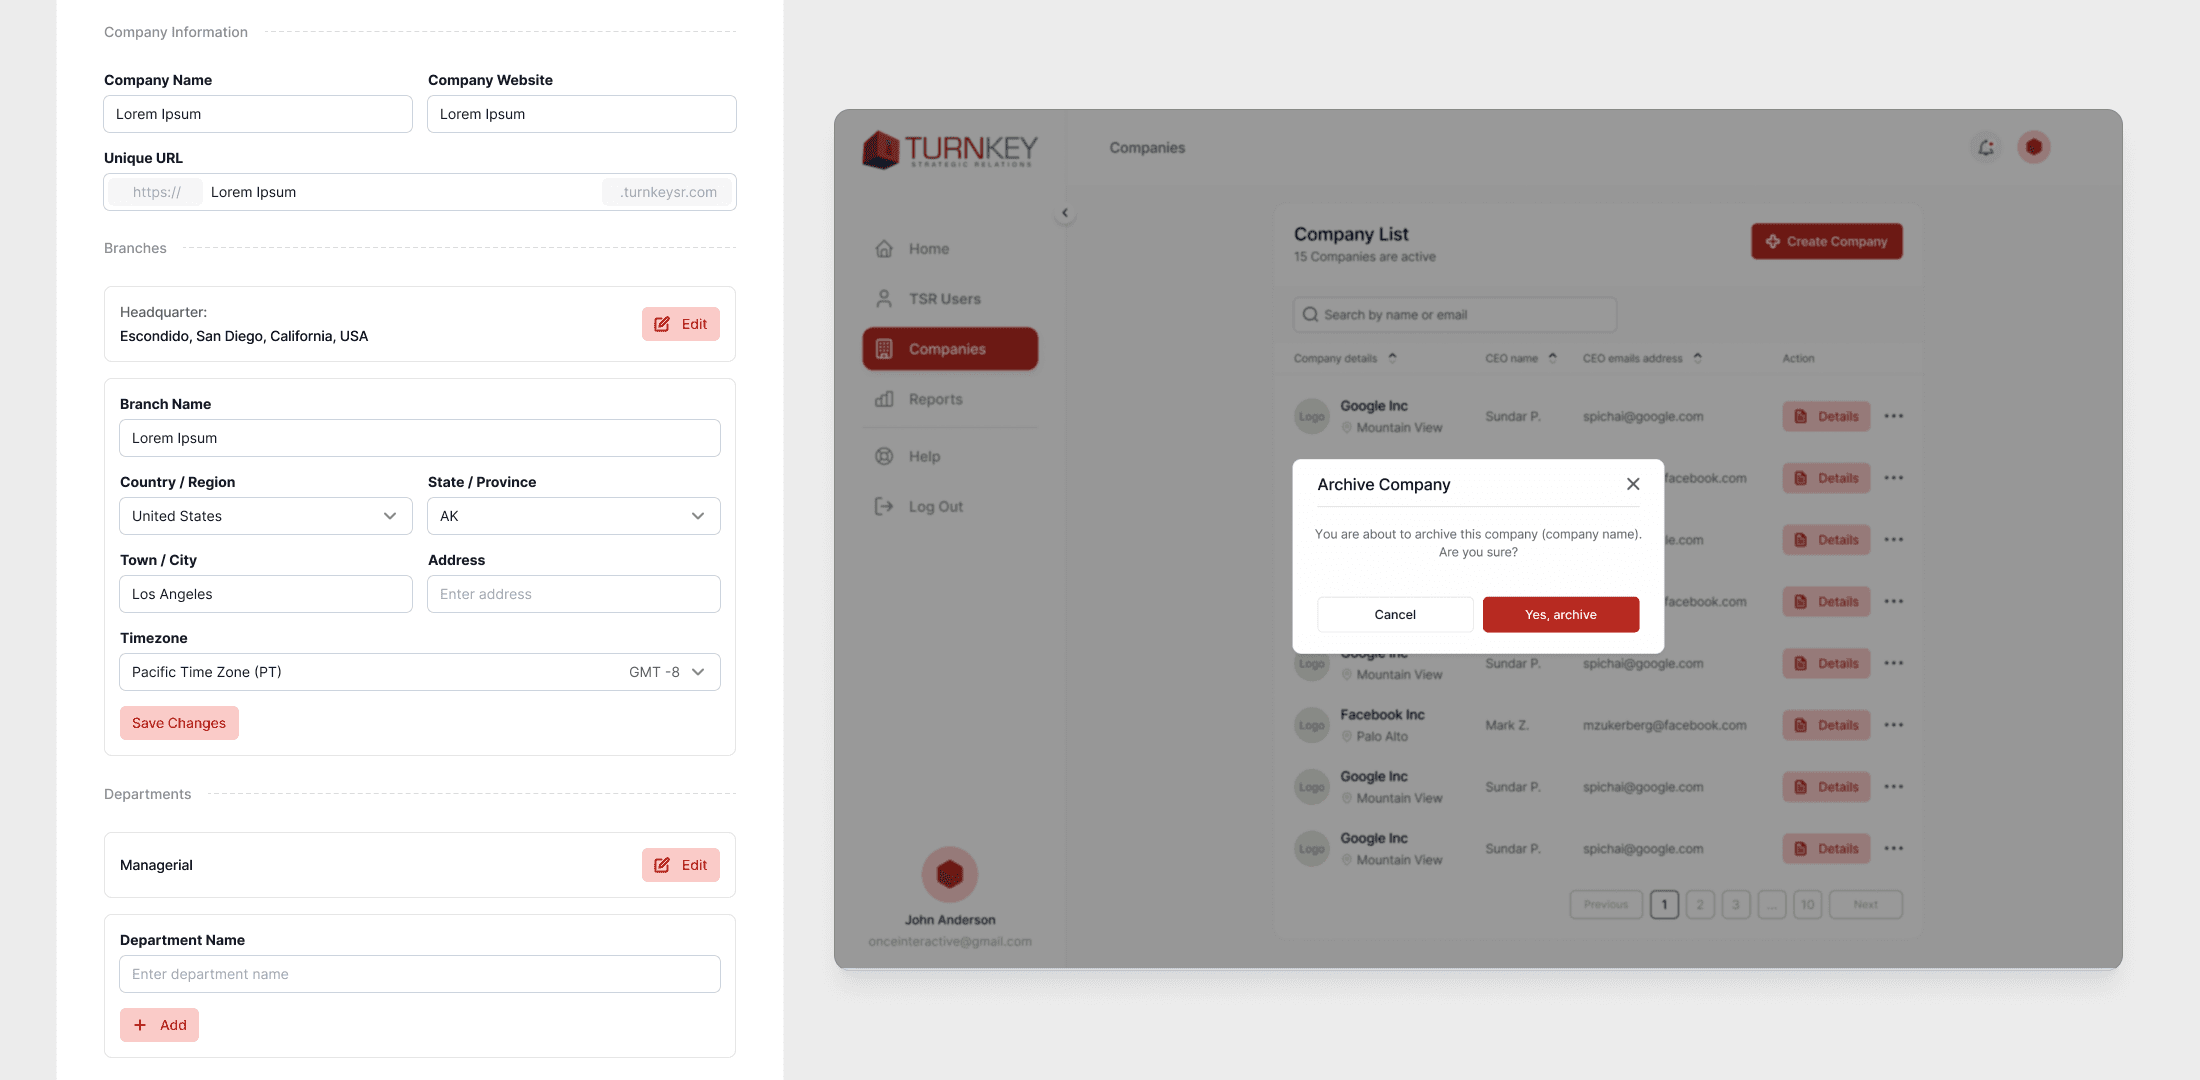
Streamlining Company Management
The Company Management Dashboard was designed to make it easy for administrators to view, edit, and manage company details, users, and organizational structures in one place. The layout ensures that the most important information—company details, leadership, branding, and goals—is immediately visible, so users don’t have to search for what they need. The archived companies section provides a clear way to access and restore inactive companies without cluttering the main view. Actions like adding users, editing company details, and managing departments are placed where users expect them, reducing friction and making updates quick and effortless. The goal was to create a clean, organized, and intuitive experience that helps teams stay focused on managing their organizations efficiently.
Designing the Organization Chart
I designed the Organization Chart page to provide a clear, structured view of company hierarchy, making it easy for users to visualize team relationships and reporting structures. The goal was to create an intuitive and scannable interface where leaders, managers, and employees can quickly find relevant information.
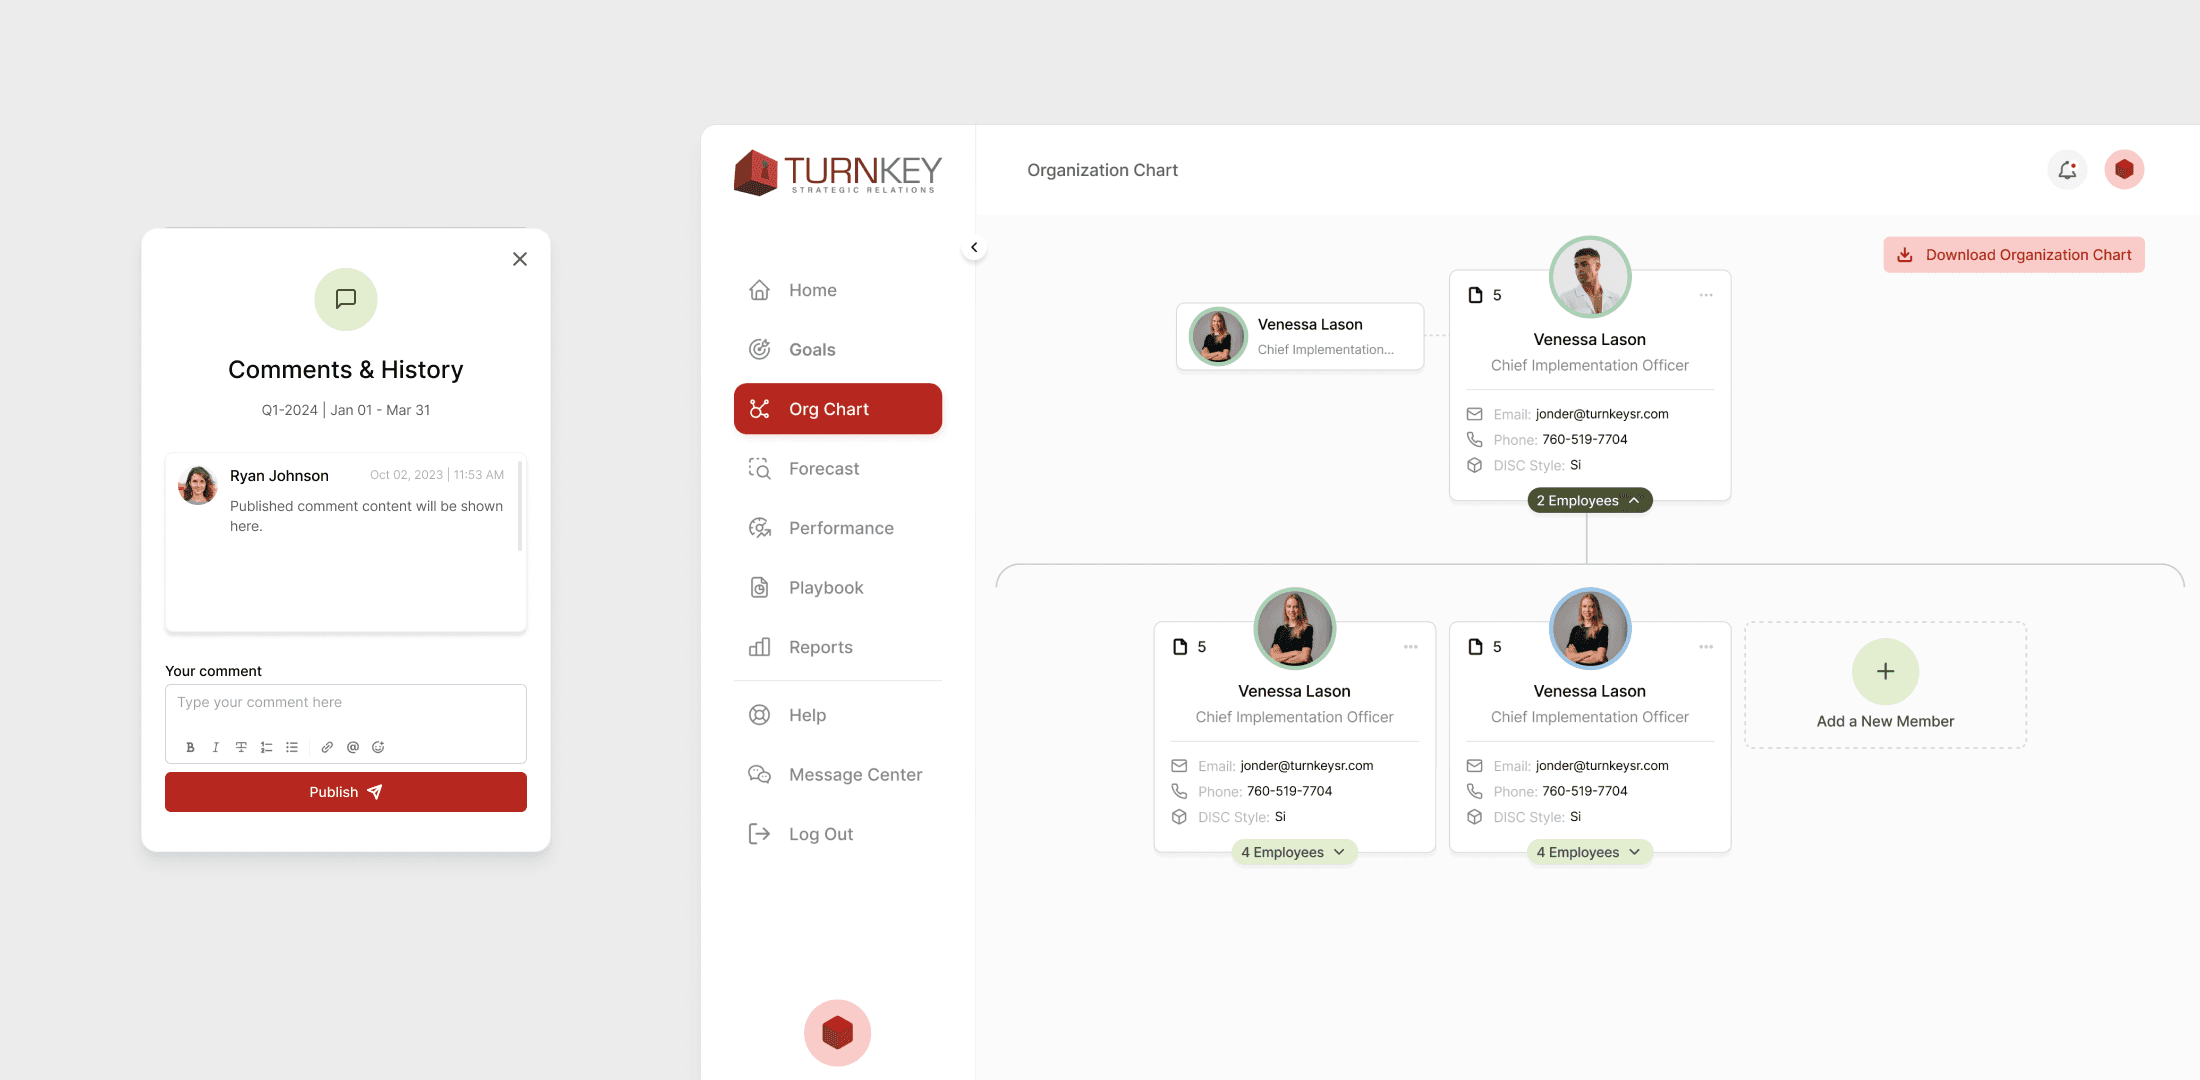
How I Designed It
I started with user research to understand how HR teams and managers interact with org charts. Through wireframes and iterations, I structured the hierarchy in a top-down format, ensuring that leaders are at the top while teams cascade below them. I incorporated employee cards with key details—name, role, contact information, and DISC style—to provide at-a-glance insights. A download feature was added for convenience, allowing users to export the org chart for offline use.

Why These Design Decisions?
Clarity & Accessibility: Users needed an easy-to-read visual representation of their teams, so I focused on a clean layout with distinct separation between hierarchy levels.
Scalability: The design accommodates growing organizations, ensuring that multiple levels can be added without overwhelming the UI.
Functionality: The “Add a New Member” button was placed at the bottom to encourage seamless team expansion.
Usability Issues Identified: During testing, I noticed duplicate employee listings, which need refinement to ensure accurate representation.
This design helps organizations maintain structure, improve communication, and streamline team management, aligning with Turnkey’s goal of clarity and alignment in performance tracking.
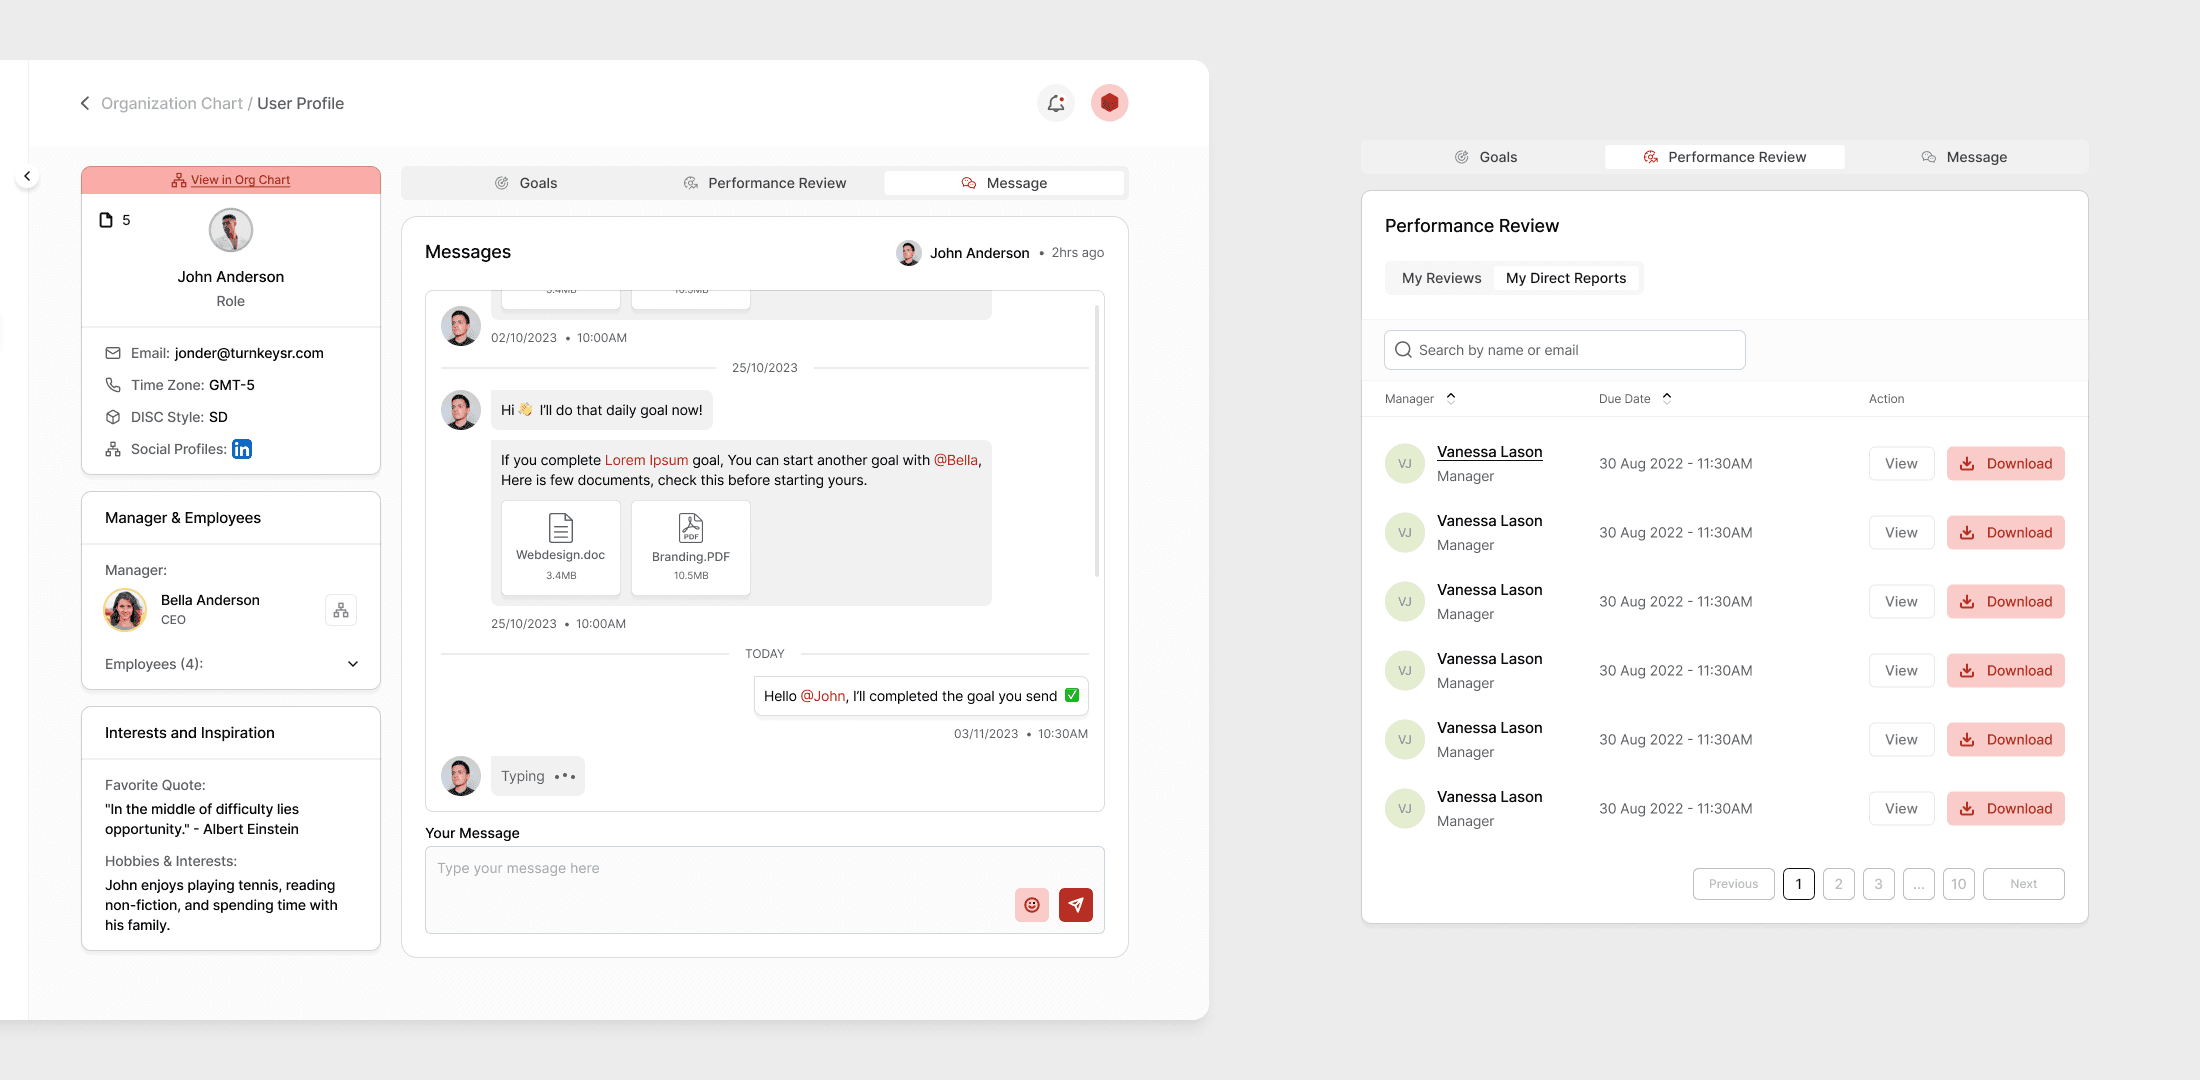
User Profile and Performance Review
This design integrates messaging, goal tracking, and performance reviews within the user profile, creating a centralized workspace for employees and managers. The messaging system allows direct communication and file sharing, ensuring seamless collaboration on goals. The performance review section provides quick access to employee evaluations, with an option to view or download reports. By keeping conversations, progress tracking, and evaluations in one place, this layout enhances engagement, accountability, and workflow efficiency within the Turnkey platform.
Prototyping the Turnkey OKR Platform
The entire Turnkey OKR dashboard was meticulously prototyped to ensure a seamless user experience, intuitive navigation, and effective goal tracking. I created low-fidelity wireframes to map out key workflows, refining them through iterative testing before transitioning to high-fidelity interactive prototypes in Figma. Every feature, from goal creation and tracking to performance forecasting and team collaboration, was tested in a simulated environment to validate usability and functionality. The prototype allowed for early stakeholder feedback, usability testing, and iterative refinements, ensuring that complex data visualization, AI-driven insights, and performance metrics were presented in an accessible and actionable way. This process enabled a smooth handoff to developers while maintaining a user-centered approach throughout the design phase.

Conclusion
My work on the Turnkey OKR platform allowed me to apply user-centered design principles to create an intuitive and efficient experience for goal setting, performance tracking, and team collaboration. By conducting user research, iterative prototyping, and usability testing, I was able to identify and address key pain points, ensuring a seamless workflow for both employees and managers. While the platform will continue evolving, the foundation I designed has established clear navigation, structured goal management, and a scalable system that will support future enhancements and drive long-term user engagement.


